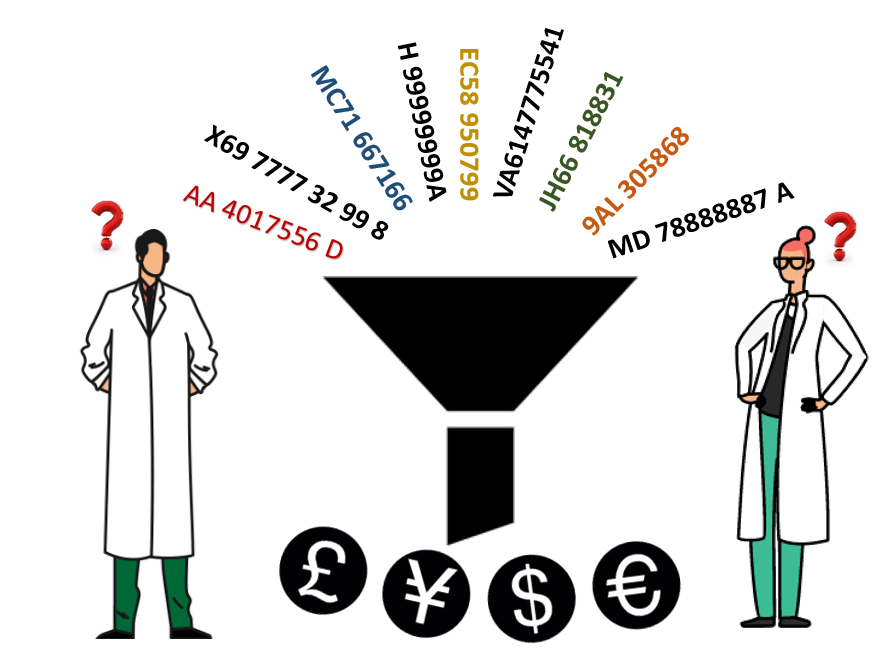
Can you quantify the financial value of reading serial numbers for use in data analytics?
This article concentrates on the monetary value of data analytics.
Accountants measure value in monetary terms only, rather than achieving policy goals such as clean notes and they will want evidence of whatever is claimed. Before a project starts, this is not necessarily straight forward.
At a high level you can use some broad brush numbers to scope the value. Based on the Bank of England’s published numbers for 2017/18, they issued 1.104 billion banknotes. The Bank spent £66 million producing 1.304 billion notes. The simple calculation means their notes cost £50.61/1000. Based on this,
- A one per cent reduction in new notes issued due to longer note life, saves the Bank £558,734 annually.
- If the Bank has 3.6 billion banknotes in circulation and 720 million banknotes in store (20%) for emergencies and work in progress, a one percent reduction in stock is worth £364,392 (one off saving).
We have listed where we think benefits would come below, but reading the published literature on where companies have used data analytics, the changes achieved are almost universally significantly more than one percent. We know the accountants may not buy that argument!
“HARD” MONETARY BENEFITS
Good data will allow the straightforward development of cost/benefit analysis to justify changes to banknote specifications, security features or the cash cycle, allowing predictions and validations based on actual data.
REDUCE THE NUMBER OF BANKNOTES REQUIRED
- Banknote stocks: It is normal for Central Banks to keep substantial stocks of banknotes. This is partly because it is hard to anticipate the unexpected and partly because the ability to forecast banknote demand accurately is difficult. The first requirement remains, the second should be significantly better with good data analytics. It should be possible to reduce the stock of banknotes currently held because forecasting is difficult, particularly if the commercial delivery arrangement with the printer is also organised effectively.
- Banknotes held in the supply chain: Separate from the overall challenge of forecasting total requirements, significant stocks need to be held at different points in the supply chain to ensure continuity of supply. After processing, vault management software can be given data about the fitness status of banknotes in store and as the Central Bank is able to map how banknotes flow over time, geographically and by user, it should be possible to reduce stocks held in the supply chain.
- Optimise the denominational structure: Understanding circulation velocity may reveal the need for changes to the denominational structure. An efficiently configured structure will reduce the volume of banknotes required.
- Specifications: As a good picture of the life of banknotes becomes clear, particularly with all data being collected rather than just the primary reason for destruction, the Central Bank has the opportunity to set the banknote specification to meet the actual circulation challenges of their banknotes. This includes selecting security features that will perform in circulation. For example, it may be that one of the more delicate security features can be used when it has previously been assumed that that denomination was too hard working, or visa versa. Any increase in note life will reduce the number of new notes needed.
LOWER COSTS AND ACHIEVE POLICY GOALS
- Clean notes: Today sorters out sort unfit notes. In future it should be possible to consider policy approaches to improve note cleanliness and extend note life. For example, if an event drives note wear, the bank may choose to seek to reduce circulation velocity by increasing the issue of new notes into an area (effectively increase the notes per head) by changing the notes issued in ATMs. Conversely it may wish to carry out a local public education/teller campaign about how notes are handled.
- Manage 3rd parties: A good understanding about whether or how product from different suppliers (substrate, print, components) performs, offers the opportunity to manage those suppliers to achieve more consistent performance so that all notes achieve best in class performance. It answers the question about whether the banknotes of all printers or all substrate suppliers are performing equally in circulation. When commercial 3rd parties such as commercial banks and cash in transit companies return notes for destruction, clarity on what they have returned is possible from the Central Bank’s sorters. It may be that they are returning a higher level of fit notes than thought and that this can be managed better.
- Understanding quality fundamentals: If Single Note Inspection Machine data is being captured by the printer, investigations in to the specification is also possible to achieve improved note performance.
- Reduce trial costs: Running trials is now a straightforward every day task. The costs and complexity will be minimal since the serial numbers used can be searched for and the results reviewed in the system without any other set up activities being needed.
- Eliminate double handling: Although perhaps a longer term opportunity, if the Central Bank has balance sheet relief arrangements with cash handling organisations, and if they read serial numbers, it would be possible to calibrate their machines using test decks, reported on NoteChain, and for the Central Bank to be certain about whether notes returned as unfit really are unfit. The Central Bank would not need to sample notes prior to destruction.
CONCLUSION
This article has focused solely on the sources of financial savings from data analytics. It has not laid out the policy goals of an Issue Department and the direct benefit that data analytics can deliver to achieve these goals. In addition, it has not discussed what has to be done to achieve these benefits or where they are derived from but this is touched on below in Annex A (where data is ideally collected from) and B (what each of those data collection points can show). As a result, we recognise that this article only offers part of the benefits and none of the costs. We would be happy to discuss this with Central Banks since we have no doubt that the benefits significantly outweigh the cost and work needed to achieve them.
ANNEX A: DATA COLLECTION
Ideally serial numbers and related detector data, would be captured at a number of points,
- Single Note Examination Machine packet data with serial numbers entered as the notes are delivered into the Bank’s vault.
- Serial numbers when notes are issued.
- Whenever the notes are put through a sorter.
- When the notes are checked immediately prior to destruction.
This can be combined with other data sources such as supply contracts, specifications, design changes, ATM usage, inflation rates, interest rates, significant economic or societal events etc.
The more data that you capture, the more complete the picture you have. We have assumed that a Central Bank will capture data:
- For each denomination
- For each series in circulation (by knowing which serial numbers are used on which series)
- By print factory (by recording which serial numbers are used for each supplier)
- By substrate supplier (by recording which serial numbers are used for each supplier)
- By sorting centre (or sorting machine)
The serial number and detector data captured provides the snapshot by date for each source. This could be note by note but is assumed that the aggregated view is always the starting point. The data captured shows the trend over time and “spikes” where different results stand out from the normal distribution. It allows inter-connections and comparisons to be considered. The historic data can be used for forward projections based on the past or supplying good quality input data to other models.
Any data is better than no data. Even if it is sampling, as is done at present at destruction, the data gives a true view of the notes at that point providing a much larger data set than alternative manual sampling systems. This data can then be put into current models, increasing confidence in the model’s outputs.
ANNEX B: WHAT THE DATA CAN SHOW
Based on:
- Printer data
- Provides the serial numbers per packet at a date. If Issue data not being captured, can be used as part of estimating the issue date.
- If with full detector data, printer data can be used to give a detailed understanding about the extent to which the adherence to the nominative specification affects the performance of the banknotes in circulation. If tolerances were tighter/looser, for example, what would be the impact?
- Issue data
- Start of life measure. With vault management systems in place, this should be straightforward to use. If notes are issued in bulk to 3rd parties, the vault management software can link back to the SNIM data. Although 3rd parties may not issue the notes immediately, assumptions can be made about the lag between leaving the Bank and issue
- Monitoring the frequency that serial numbers are seen
- Which notes are circulating, which are not? (A sense of the active and non-active populations)
- Velocity of circulation: how hard are notes working
- How circulation velocity changes: we can estimate at what point notes cease to be fit (after how many sorts) and assess the circulation population in this context
- Note life can be calculated with a high level of confidence based on date of first sorting and frequency of subsequent sorting
- Level of fitness for each criteria when seen
- What is triggering destruction?
- What is the speed and shape of the degradation?
- Note life and fitness duration
- Are there linkages between what is measured for degradation? If soil increases, does limpness increase as well?
- Are there differences in note performance depending on where they have been used, who supplied them, the number of notes in circulation etc? Understanding any differences may allow action to be taken
- Stock management
- By looking at stock that does not move and what does move and when, what is “emergency stock”, what is “work in progress” and is there a level of stock that just never moves that could, in fact, be removed?
- Is stock being managed in accordance with policy?
- What stock is in the “system” in total and where? How close to end of life is the used note stock? Is there a need to move stock or to order new notes?
- What are the peak events? Can they be anticipated in future?
- Note destruction
- Reading numbers immediately prior to destruction combined with knowing when they were issued, allows accurate note life to be known
Monitoring the reason that triggered destruction is important but it is also possible to see how the note had degraded against other criteria. This allows accurate scenario planning to understand the impact of changes to the specification or note issue policy.
Comments are closed.